PET
Imaging
Table Of Contents
q��� Physical
Principles of PET imaging
q��� Image
artifacts on PET/CT exams:
q��� [18]
- F-fluorodeoxyglucose (FDG) Imaging: Basic principles:
q��� Standardized
uptake ratio (SUR/standardized uptake value (SUV)
q��� Musculoskeltal
and soft tissue activity
Pet imaging General Topics
q Physical Principles of PET imaging
o Agents used in PET imaging are typically produced in a cyclotron by bombarding a stable element with protons, deuterons, or helium nuclei. The resulting isotope will contain excess protons and will decay by positron emission
o Before it undergoes an annihilation reaction with the production of two 511 keV photons which travel in a 180 degree direction of one another
o The primary limiting factor that determines the spatial resolution of a PET scanner is the size of the scintillation crystal (ie: the number of crystals used in the scanner) -- the smaller the crystal, the greater the number of detectors, and the better the spatial resolution [18]
o
Bismuth germinate oxide (BGO ) crystals are generally used in
conventional PET imaging systems. BGO
crystals have a high stopping power (high efficiency), high spatial resolution,
and are 50% more efficient than thallium-doped sodium iodide -- NaI (Tl) -- crystals
q System dead time:
o When a photon interacts with a detector the crystal produces a light flash which is collected by several photomultiplier tubes (PMT's).
o The photomultipliers tubes determine the enrgy and spatial position of the event and this is followed by coincidence processing [18].
o The total time required to complete these tasks is the system dead time.
o During this time, the system is unable to collect new incoming events which will be lost
q 2D-3D Acquisition:
o
A general rule of thumb for PET imaging using a BGO camera is that if there are sufficient counts
to perform a study in 2-D mode, then that is the preferred scanning method.
o 2D uses lead septa decreases scatter
o 3D does not � higher counts
q Attenuation Correction
o The disadvantages of attenuation correction is that it requires more time for image acquisition and there is the potential to add noise to the image if the attenuation measurements become misaligned by patient motion.
o
Attenuation correction is performed to
account for internal absorption of photons.
o Attenuation correction of emission images can be performed by obtaining a transmission scan utilizing a 511 keV source (such as 68Ge), 137Cs (662 keV), or using x-ray transmission images from a CT scan.

Figure 1 - Attenuation correction: The images below are from
the same patient. The image on the left is non-attenuation corrected (the lungs
and skin surface appear warm). The right image is corrected for attenuation.
Note the improved visualization of structure
o Having the patient's arms by their sides also produces beam hardening artifact and therefore, whenever possible, the patients arms should be immobilized above their head [28]. Imaging though the chest is optimally performed during a normal expiration breath hold
q Image artifacts on PET/CT exams:
o Co-registration of the PET and CT data sets is not always perfect due to respiratory motion- this problem is most significant in the lung bases, lung periphery, and liver dome.
o
Liver lesions may be incorrectly localized to
the lung bases [13]. CT images acquired during normal expiration rather than
with shallow respiration demonstrate improved co-registration of pulmonary
nodules with PET images
o IV, oral or metallic artifact may result in increased FDG falsely.
PET Oncologic Imaging
q [18] - F-fluorodeoxyglucose (FDG) Imaging: Basic principles:
o One of the biochemical characteristics of malignant cells in an enhanced rate of glucose metabolism due to increased number of these cell surface glucose transporter proteins
o The most common glucose transport protein over-expressed on the tumor cell membranes is Glut-1, which is insulin independent.
o Once inside the cell, FDG is phosphorylated by hexokinase into FDG-6-phosphate. FDG-6-phosphate does not enter into further metabolism and accumulates intracellularly
o Unfortunately, FDG is not a cancer specific agent and its uptake has been described in a number of inflammatory lesions including sarcoid, tuberculosis, fungal infection, and cerebral abscess.
o
A persistent or increased level of FDG
accumulation within a lesion on delayed imaging is indicative of a malignant
process
o FDG imaging is performed in the fasting state to minimize competitive inhibition of FDG uptake by glucose [14].
o �A 4 hour fast is recommended prior to initiation of the PET FDG study.
o FDG uptake is significantly influenced by plasma glucose levels and uptake will be decreased when plasma glucose levels are elevated (elevated serum glucose levels can result in decreased FDG accumulation within the tumors) [4,14].
o If the glucose level is higher than 150-200 mg/dL, the study should be delayed until the glucose level is under 200 mg/dL [3].
o Administering insulin at the same time as FDG should be avoided because it tends to increase accumulation in skeletal muscle and thus less FDG is available for accumulation in tumors.
o For oncologic imaging, FDG-PET scans are performed approximately 60 minutes following the intravenous injection of 10-20 mCi of FDG. A two dimensional (2D) acquisition is acquired from the base of the brain to the mid thighs.
o Despite this limitation, using modern PET scanners, objects that measure as small as 5 mm can be visualized
q Response to Therapy
o Imaging 1-2 weeks after completion of chemotherapy is recommended to avoid transient fluctuations in FDG metabolism [53].
o For radiation therapy a longer delay may be required (up to 60 days) prior to imaging.
o Generally, FDG uptake 6 months after radiotherapy is associated with tumor recurrence
q Standardized
uptake ratio (SUR /standardized uptake value (SUV)
o
A standardized uptake ratio (SUR ), also known as a standardized uptake value
(SUV), is used to determine if a lesion has increased 18FDG
activity.
o
SUR =
Mean selected region activity (mCi/ml)/[injected dose (mCi)/body weight
(kg)]
o
An accurate SUR
determination is more difficult for nodules smaller than 1.5 cm due to partial
volume effects [85].
o
An SUR
greater than 2.5 has been shown to be very sensitive and specific for
malignant lesions.
o Factors affecting SUV measurement:
� Plasma glucose levels: High plasma glucose can decrease FDG uptake by competitive inhibition [111] and this will decrease the calculated SUV [110].
� Time after administration that SUV is measured- FDG uptake in malignant tumors is time dependent and often increases for up to 90 minutes after tracer injection [118]. SUV should be measured at a fixed time following injection to ensure accuracy.
� Subcutaneous infiltration of the tracer:
�
Body weight or body surface area
�
Size of the region of interest
�
Resolution of the scanner
� Type of image reconstruction and attenuation correction:
q Head and neck:
Figure 2 -
o Low to moderate FDG uptake occurs in the lingual and palatine tonsils and at the base of the tongue because of physiologic activity associated with the lymphatic tissue in Waldeyer's ring

Figure 3 - Head and neck activity: The images below show
typical uptake in the tonsils (black arrows),� submandibular glands (blue arrows),
and parotid glands (red arrows)
q Myocardium
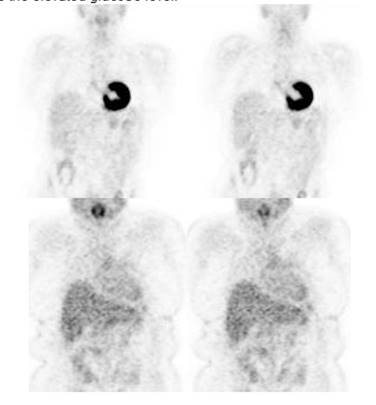
Figure 4 - Myocardial activity: Myocardial uptake can be
very variable. The patient on the left below had a glucose level of 97 prior to
FDG injection. Despite the normal serum glucose, note the intense cardiac
activity in this patient. The patient on the right
q Renal/Urinary bladder
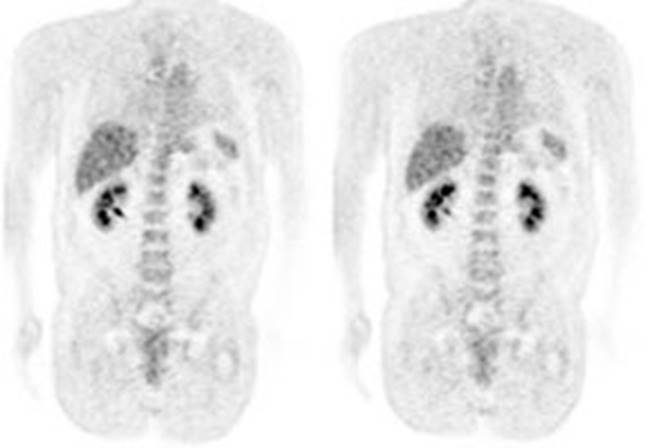
Figure 5 - Genitourinary activity: The image below demonstrates normal renal and hepatic activity.
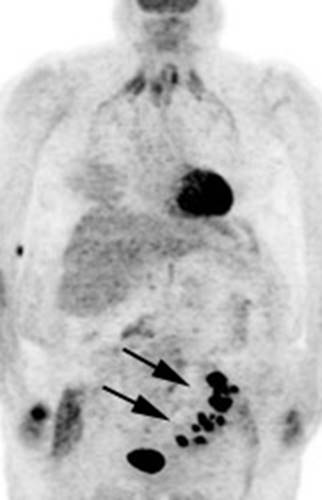
Figure 6 - Genitourinary activity: The image below demonstrates activity within the collecting system of a transplanted kidney (black arrows). This should not be mistaken for an abnormality.
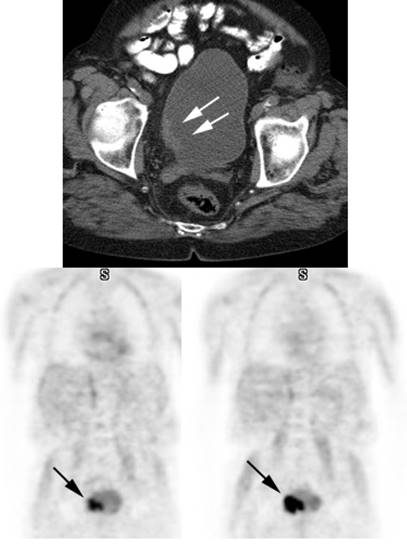
Figure 7 - Bladder cancer: Despite urinary excretion
of the radiotracer, this patients bladder cancer
(white arrows) is readily identified on the PET scan (black arrows). In
general, however, urinary excretion of FDG limits evaluation of urinary tract
malignancy
q Musculoskeltal and soft tissue activity
o Exercise should be avoided on the day of scanning to avoid muscle uptake.
o In patients with COPD, intercostal muscle uptake can be seen due to excessive contraction required to facilitate expiration
o Insulin injection just prior to FDG administration will result in increased muscle uptake

Figure 8 - Muscle activity: Note the marked muscle
uptake within the forearms in this patient. We suspect that the patient was cold
or nervous and clenching there hands following
injection of the tracer.

Figure 9 - Laryngeal activity: Likely related to talking during tracer uptake.
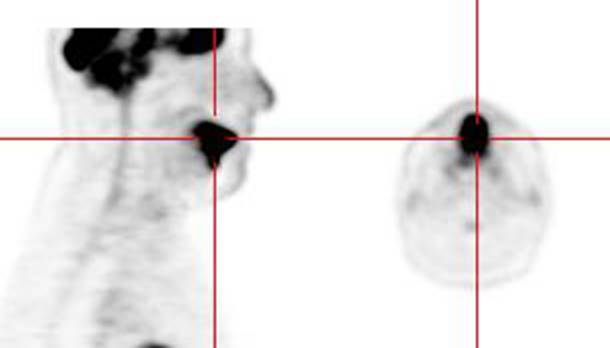
Figure 10 -I ntense
uptake in the tongue: Intense tracer uptake in the tongue in this patient was likely related to
nervous movement of the tongue during the tracer uptake phase
o Brown Fat:
� Prominent tracer uptake has also been described within the supraclavicular fat on PET/CT in about 2% to 4% of patients- the etiology is not well understood, but is felt to be related to the presence of "brown fat"

Figure 11 - Brown Fat: Prominent, symmetric
supraclavicular tracer uptake was seen in this patient without a corresponding
CT finding. Uptake in this area has been felt to be related to the presence of
"brown" fat.
o Uptake in benign bone lesions can be seen, such as Pagets disease [39]. Acute (fractures less than 3 months old [111]) or actively healing fractures also show increased FDG activity
o Decreased skeletal activity can be seen following radiation therapy
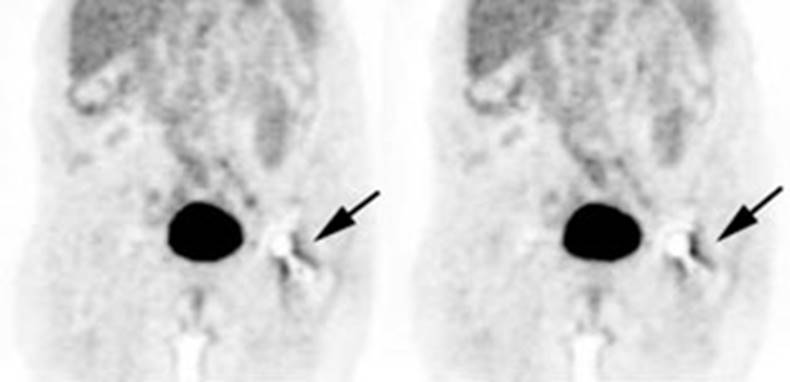
Figure 12 - Peri-prosthetic activity: The patient below had a
left hip prosthesis. The PET scan was performed for the evaluation of a lung
nodule. The patient had no symptoms referable to the left hip. Note the
increased activity along the margins of the neck and head portions of the
prosthesis. This finding can be seen normally and should not be considered
evidence of infection.
q Gastrointestinal tract
o Variable activity can be seen in the GI tract- partly due to smooth muscle activity associated with peristalsis, bacterial uptake, gastrointestinal lymphoid tissue, and metabolically active mucosa [20,30,54,95].
o Large bowel activity is common and can be focal, segmental, or diffuse [40].
o Focal intense uptake in the colon is an uncommon finding (1-2% of cases) and should be further evaluated with colonoscopy to exclude a neoplastic process which can be found in a large percentage of patients.
o Segmental colonic uptake is usually related to inflammation, while diffuse uptake is usually not associated with underlying bowel abnormality
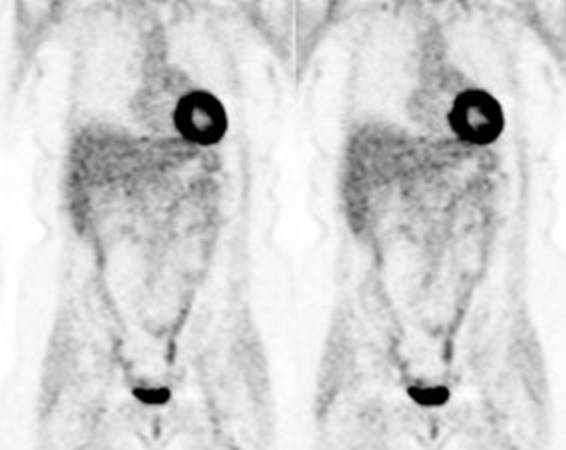
Figure 13 -

Figure 14 - Intense right colon
activity: Note the
intense activity in the right colon in this asymptomatic patient. Increased
activity in the right colon can sometimes be seen. Note uptake in the patients
left upper lobe lung cancer. Focal activity in the left upper abdomen was
related to the stomach

Figure 15 - Diffuse large bowel activity: Diffuse increased colonic FDG uptake was seen in this asymptomatic patient. Diffuse uptake is usually not associated with underlying bowel abnormality.
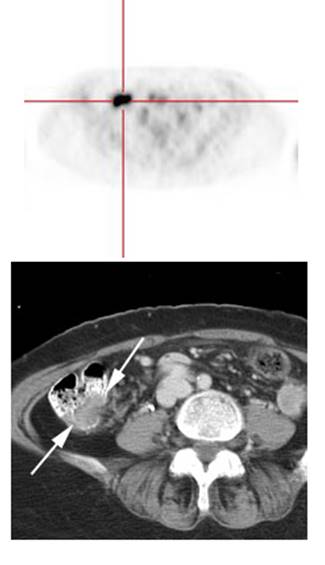
Figure 16 - Focal colonic uptake
associated with colon cancer: This patient had focal tracer uptake in the region of the cecum. CT
demonstrated a soft tissue mass which was found to be a primary colon cancer on
colonoscopy. Focal areas of colonic tracer uptake should be further evaluated.
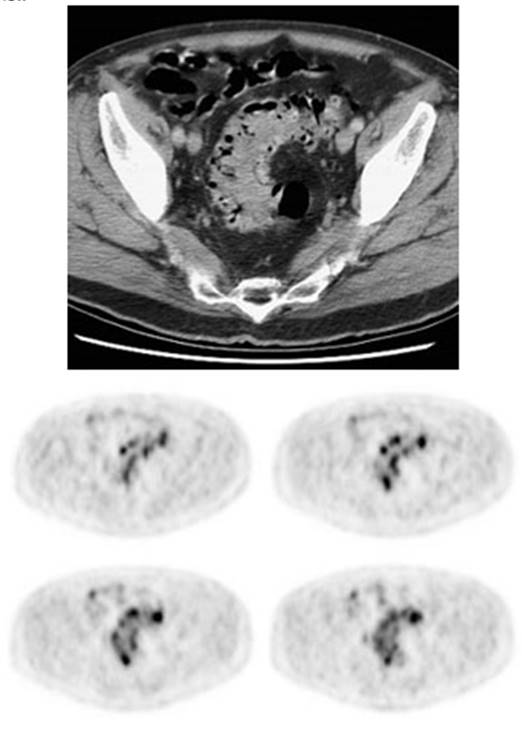
Figure 17 - Segmental colon activity in
diverticular disease:
Note the segmental FDG uptake corresponding to an area of severe diverticular
disease on CT. There is likely underlying inflammation or muscular spasm which
contributes to the FDG uptake
q Stomach
o stomach is usually faintly seen (but uptake can be intense) - activity is seen only in the wall of the stomach (possibly related to smooth muscle activity) giving it a "ring-like" appearance
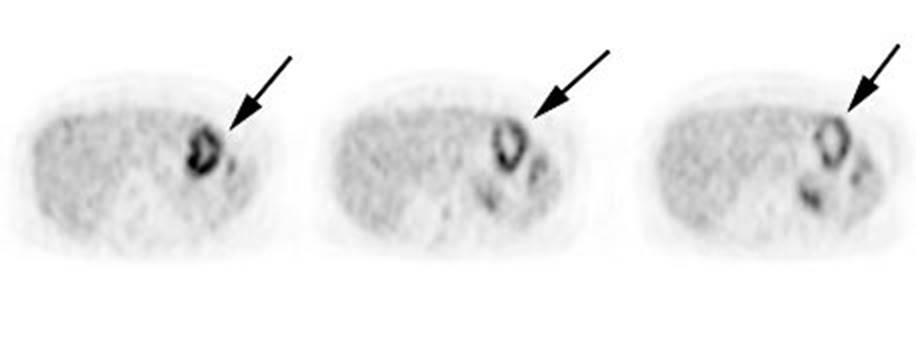
Figure 18 - Gastric activity: Gastric activity can be very intense- even in patients without gastrointestinal disease. Note the "ring-like" appearance of normal gastric activity.
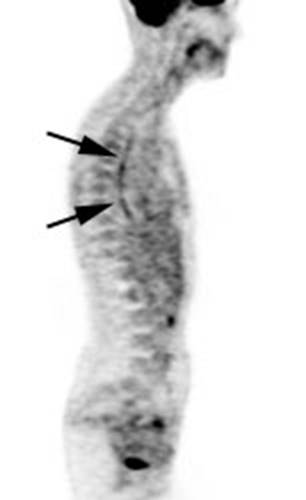
Figure 19 - Esophageal activity: The image below
demonstrates non-specific esophageal activity which appears as linear uptake
anterior to the spine (black arrows).
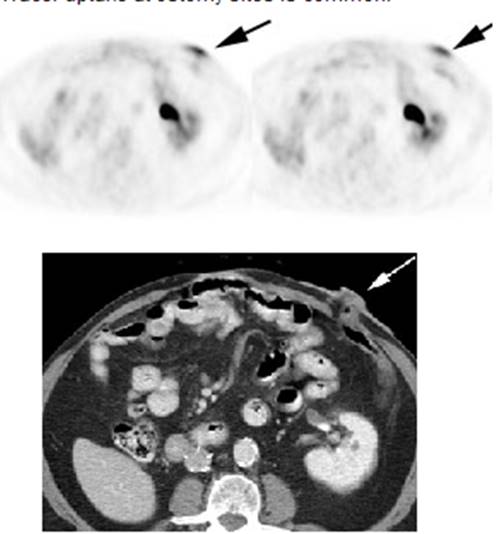
Figure 20 - Ostomy sites: Tracer uptake at ostomy
sites is common
q thymus
o FDG accumulation in the thymus suggests pathology when it does not have a typical triangular shape or if the activity is very intense (SUV max greater than 4.0
q Bone marrow
o Faint activity is generally identified within the bone marrow [7].
o The accumulation is generally homogeneous and has SUV ratios between 0.7 to 1.3 [7]. Bone marrow activity that is greater in intensity than the liver is considered abnormal [39].
o �Increased bone marrow activity can be seen with bone marrow recovery following chemotherapy, but this usually resolves by one month post-therapy [4].
o �Treatment with granulocyte stimulating factors can also produce diffuse skeletal FDG accumulation [9] which can interfere with accurate PET imaging
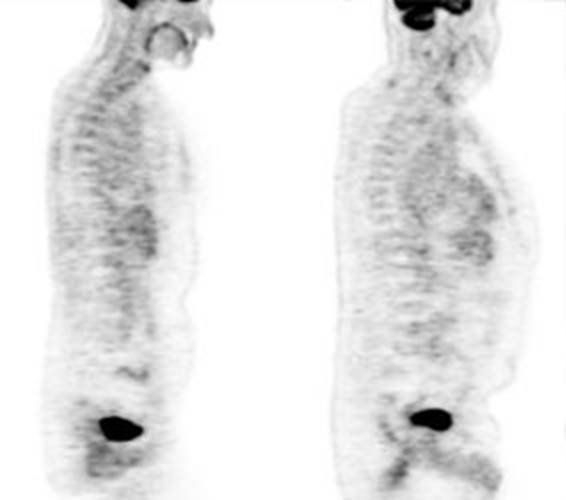
Figure 21 - Marrow activity: The images below are from
two separate patients each showing mild FDG accumulation within the vertebral
bodies.
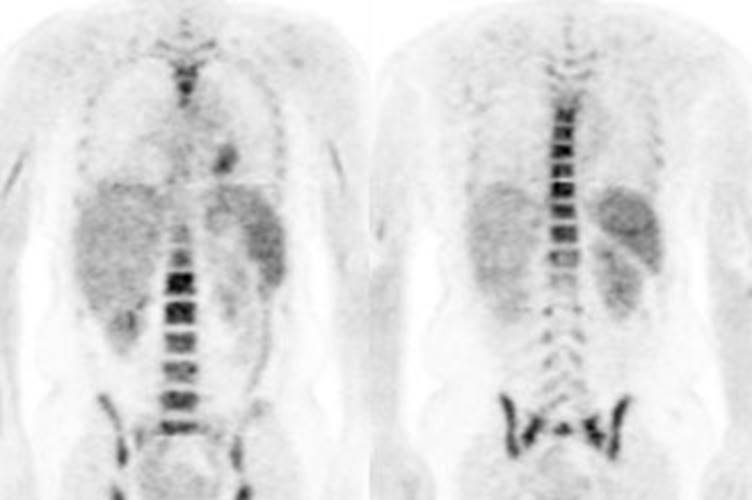
Figure 22 - Growth colony effect: The patient shown below
had received growth colony stimulating factor (GCSF). Note the extensive
increased marrow activity. Note increased splenic activity also seen as a result of GCSF therapy.
q Thyroid
o Patients with focal uptake should be further evaluated due to a higher risk of the finding being associated with thyroid malignancy (27-57% risk for malignancy)
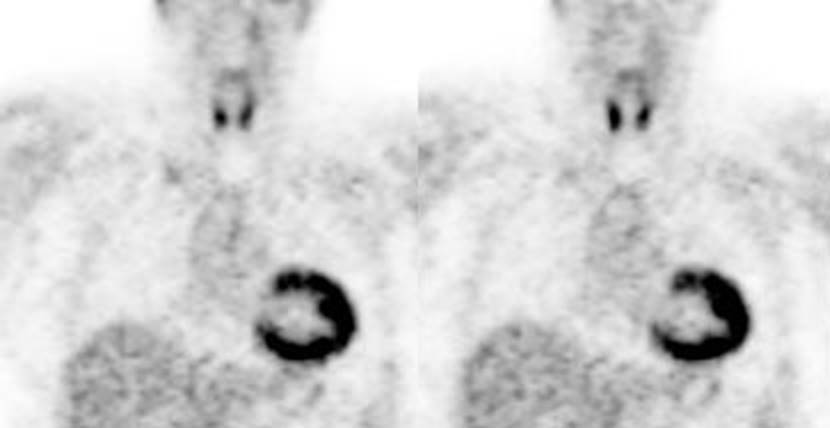
Figure 23 -
q Other
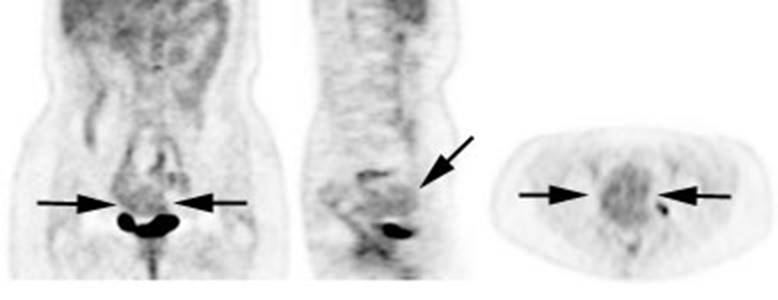
Figure 24 -
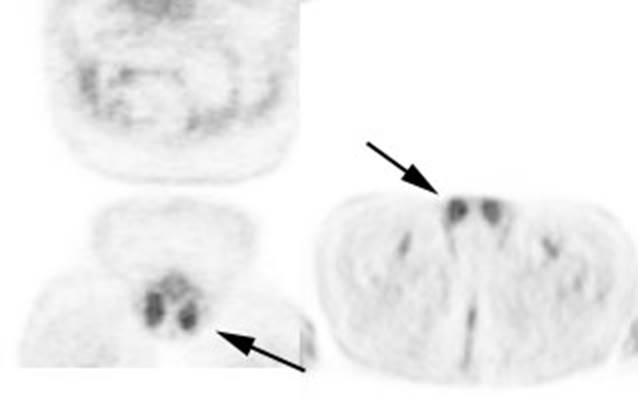
Figure 25 -
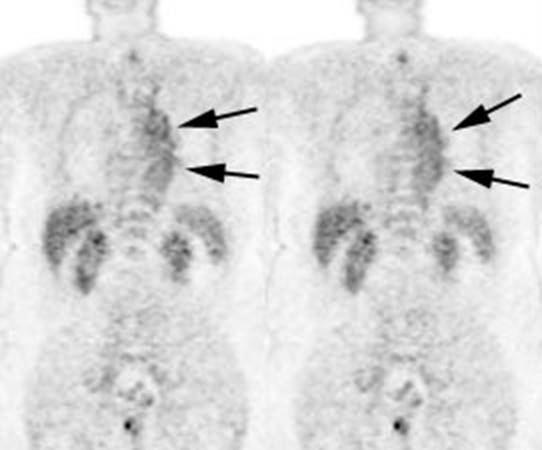
Figure 26 -
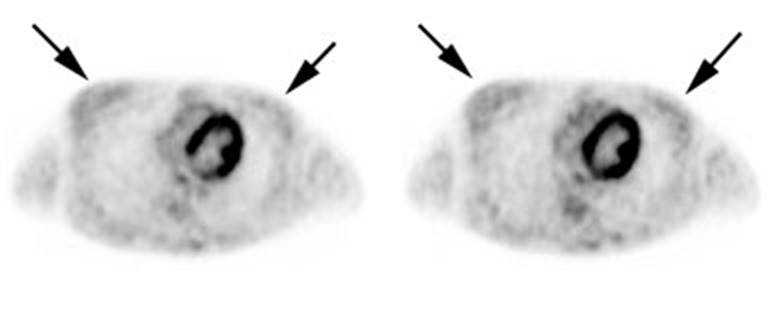
Figure 27 -
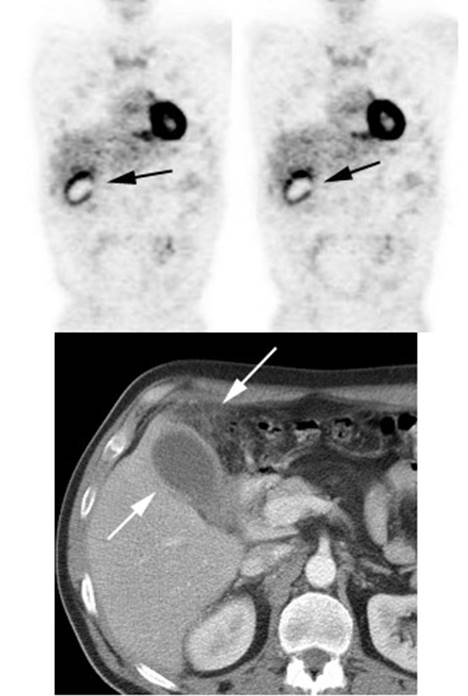
Figure 28 - Inflammation: The image below demonstrates ring-like increased tracer activity surrounding the gallbladder in a patient with cholecysitis (black arrows). Note the gallbladder wall thickening and adjacent inflammatory changes seen on the patient's CT