Verify
Inspect segmentation for every measurement that will influence the impression.
For screening interpretation, treat NeuroQuant as a quantitative adjunct to your MRI interpretation—not as an automated dementia diagnosis or a stand-alone “brain health” score. The most important principle is concordance: do the measured volumes agree with the segmentation, the visible anatomy, the clinical history, and—when available—a technically comparable prior examination? Independent studies support its usefulness but also demonstrate clinically consequential segmentation errors and limited stand-alone diagnostic performance. pmc.ncbi.nlm.nih
This radiologist-oriented guide emphasizes screening patients rather than patients already referred to a memory clinic. The supplied material draws on Cortechs’ technical and training materials, Prenuvo’s published description of its program, and independent clinical studies. Prenuvo’s public materials do not specify the exact software version, report package, acquisition parameters, or internal reporting thresholds you will use; those need to be confirmed locally. prenuvo
Inspect segmentation for every measurement that will influence the impression.
Interpret measured volumes alongside visible anatomy, clinical history, and technically comparable prior imaging.
A low percentile is a reference-distribution finding; it does not establish Alzheimer disease or predict future dementia.
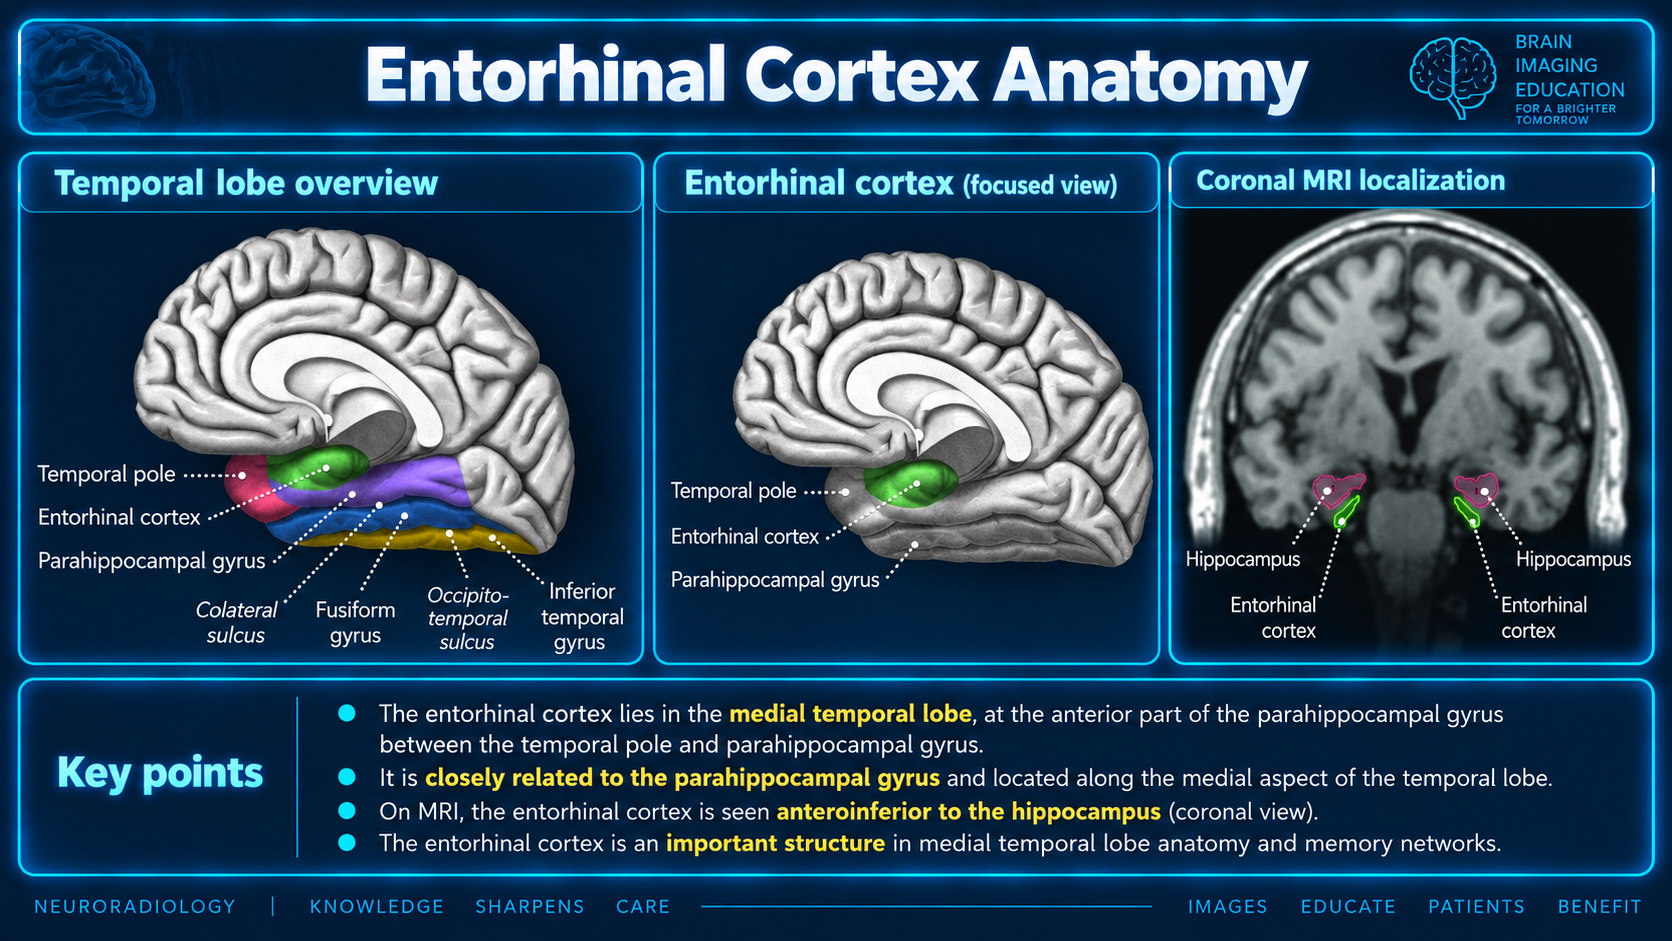
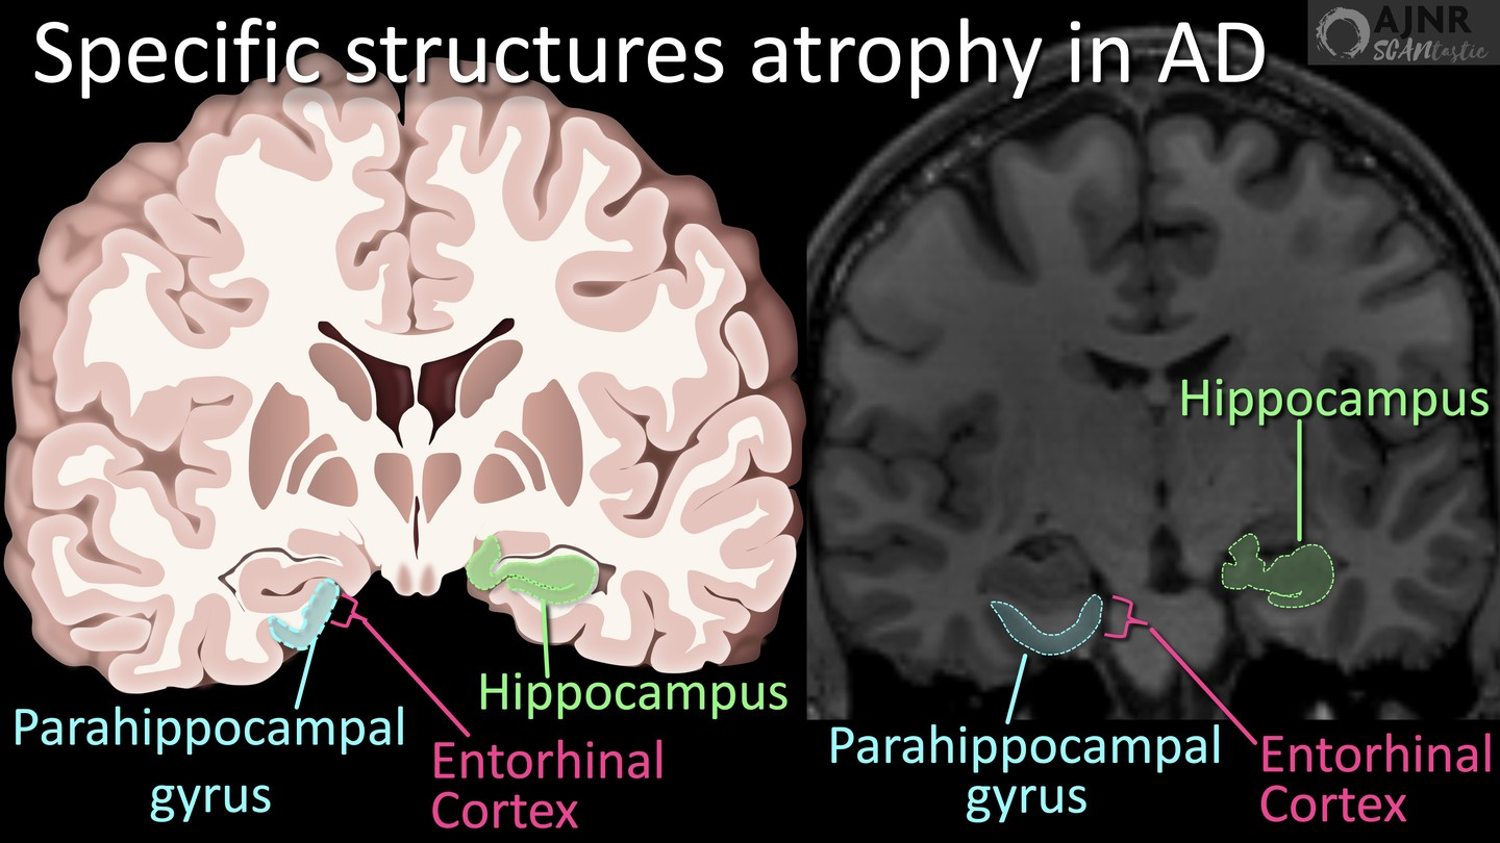
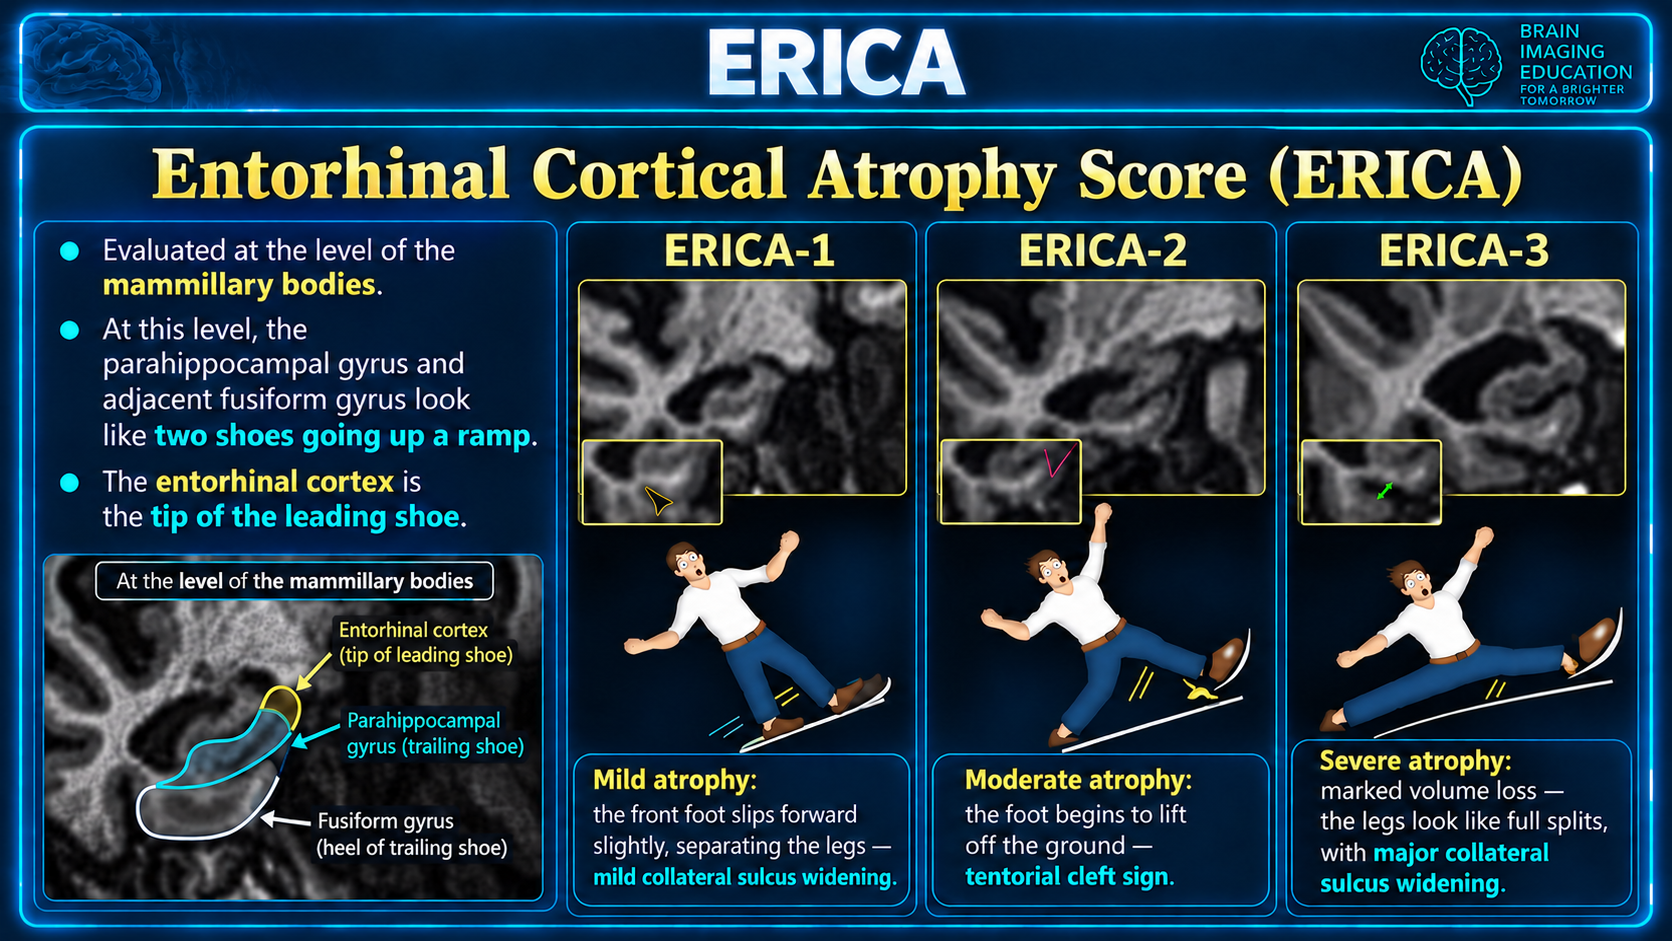
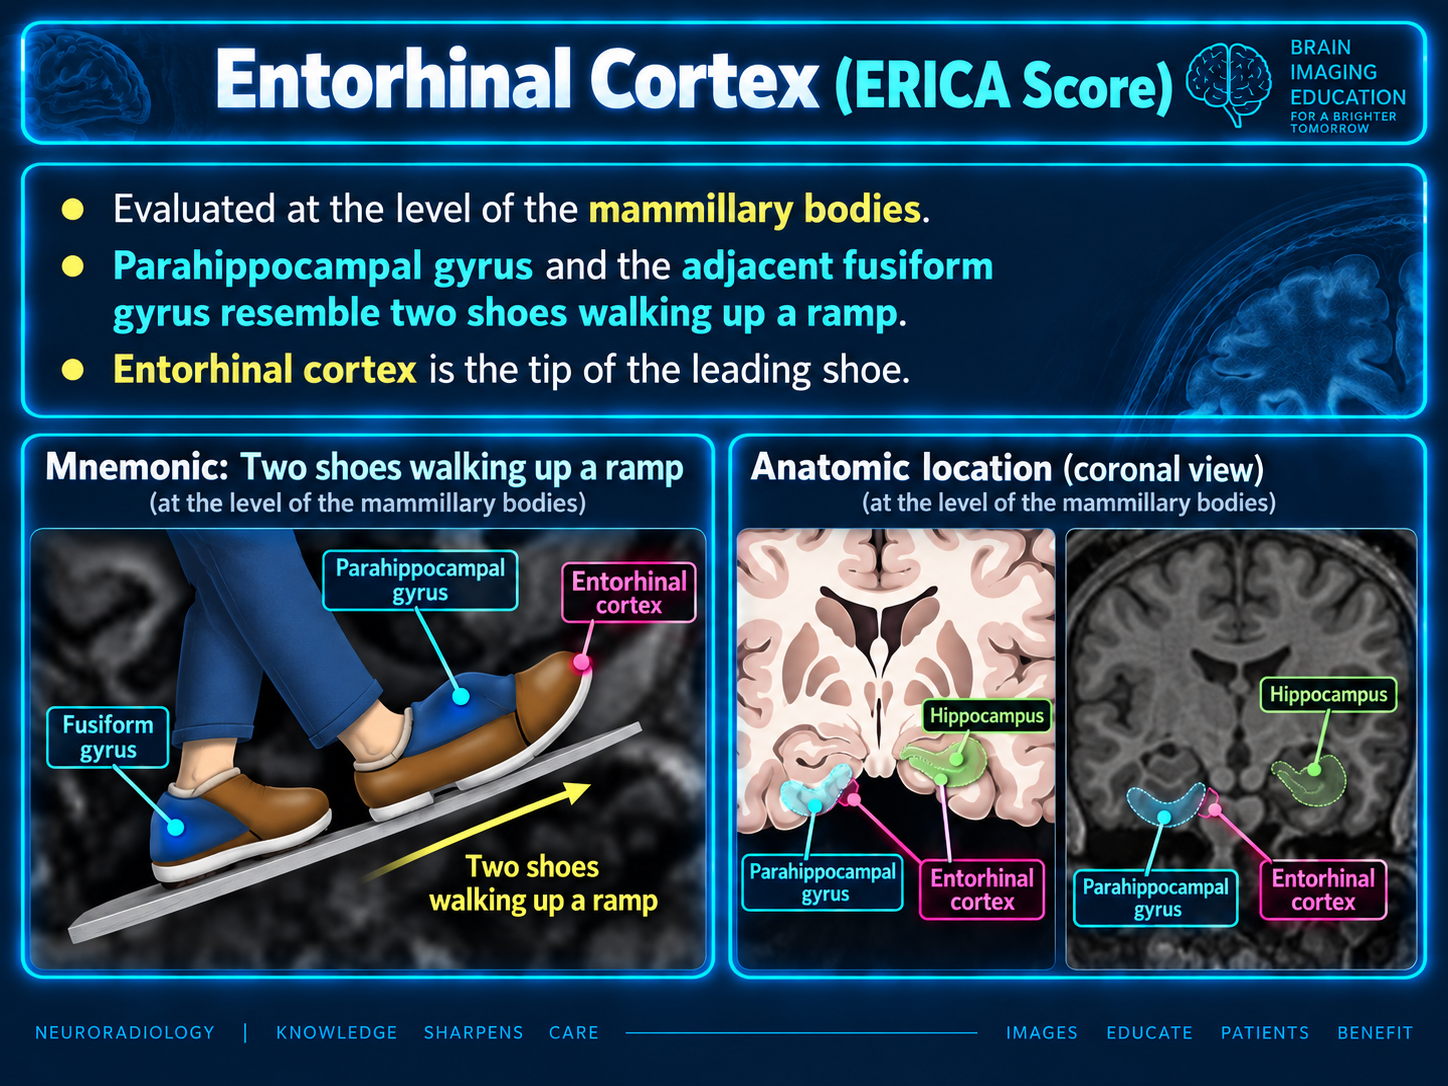
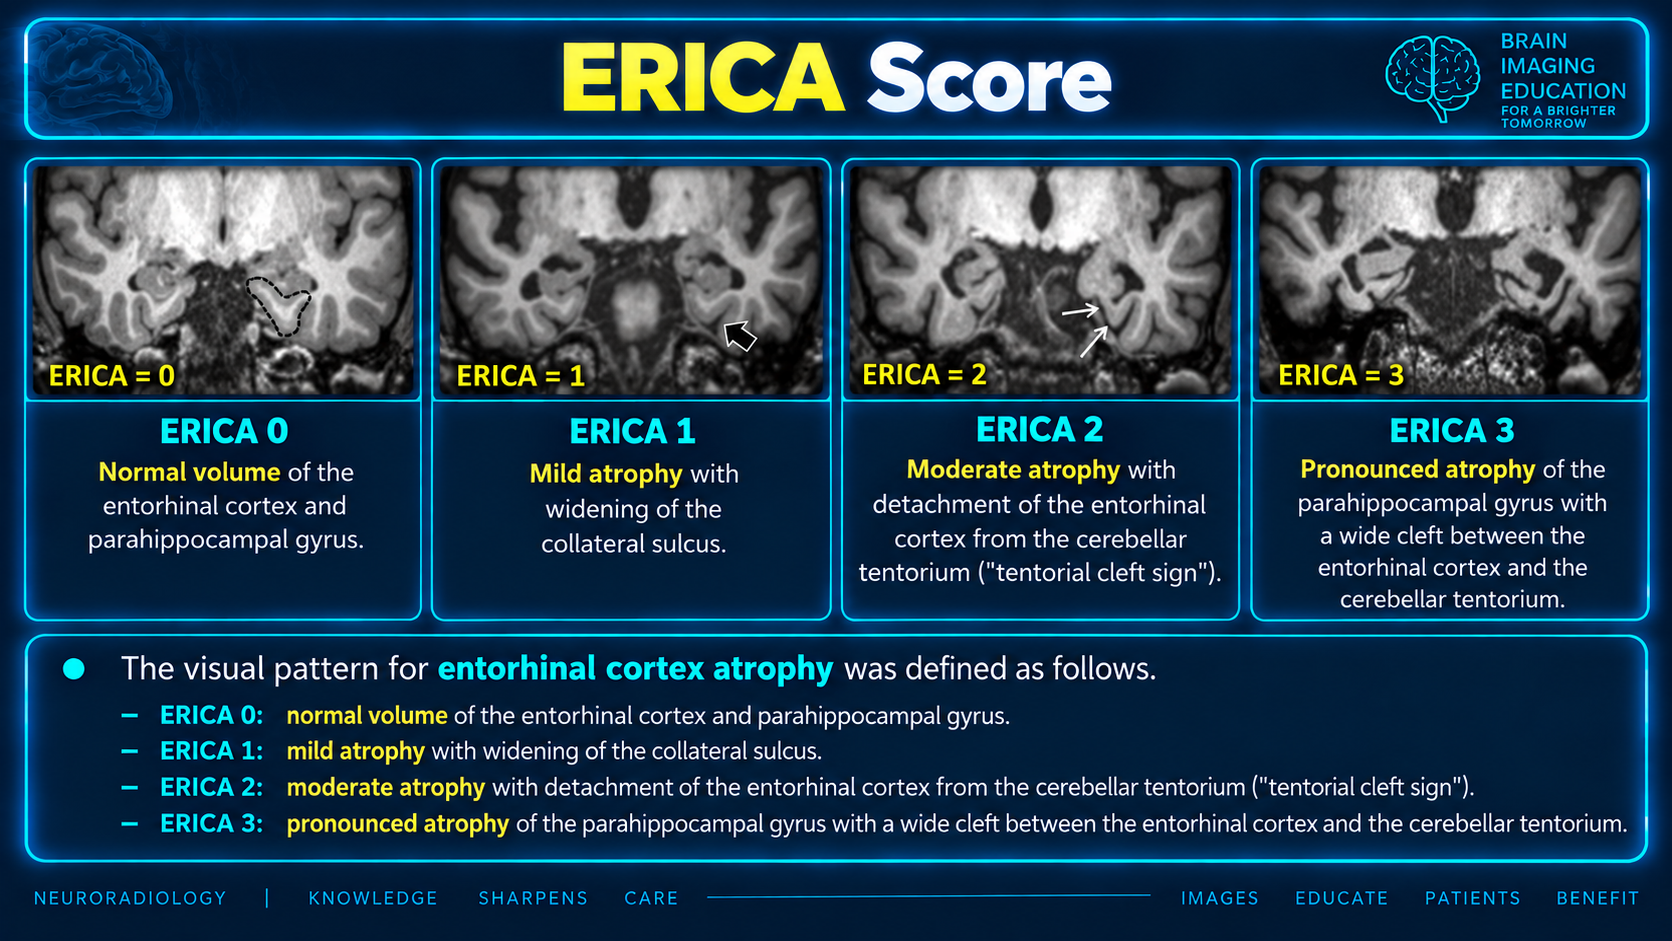
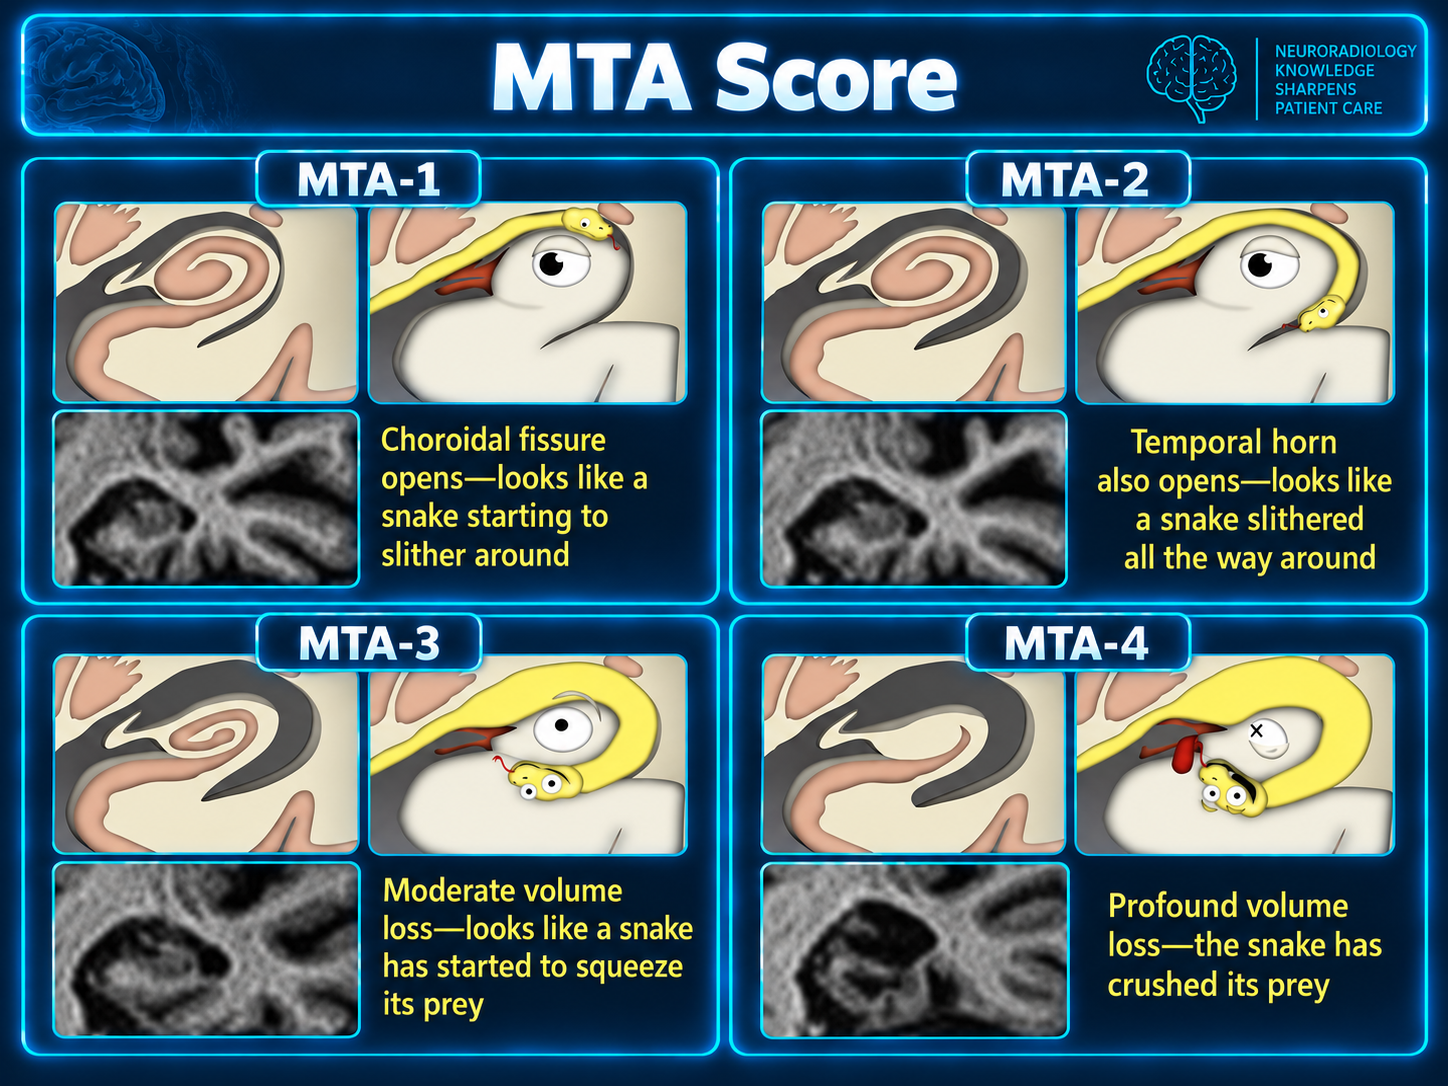
The supplied figures are anatomy and visual atrophy teaching references, rather than NeuroQuant reports or segmentation examples. ERICA and MTA graphics are preserved as supplied; they do not define NeuroQuant percentile thresholds. Figure 1 describes the entorhinal cortex as both within the anterior parahippocampal gyrus and “between the temporal pole and parahippocampal gyrus.” This wording is retained in the source figure and should not be used as a precise segmentation boundary. The supplied prose provides no complete MTA or ERICA scoring protocol.
NeuroQuant segments a compatible 3D T1-weighted acquisition, calculates regional brain volumes, and compares measurements with a normative reference population accounting for age, sex, and intracranial volume. It returns volumetric reports and color-labeled images for verification. Report packages differ: the age-related atrophy report emphasizes hippocampal and ventricular measurements, while other reports address hippocampal asymmetry and broader regional volumes. cortechs
Keep these distinctions separate:
| Output | Meaning | What it does not establish |
|---|---|---|
| Absolute volume, usually cm³/mL | Estimated volume of the segmented structure | Whether that volume is abnormal for this patient |
| Percentage of intracranial volume | Regional volume normalized to head size | Percentage of brain tissue “lost” |
| Normative percentile | Position relative to the reference population after applicable adjustments | Probability of Alzheimer disease, cognitive performance, or future dementia |
| Hippocampal occupancy score | Relationship between hippocampal and inferior lateral ventricular volumes | A disease-specific biomarker |
| Serial volume change | Difference between measured volumes on examinations | True biological change unless technical comparability and segmentation are verified |
These interpretations follow the vendor’s measurement definitions; the limits on diagnostic inference are supported by independent clinical validation. pmc.ncbi.nlm.nih
For example, a hippocampal volume at the 3rd percentile means it is low relative to the reference distribution. It does not mean the patient has lost 97% of the hippocampus, or has a 97% probability of Alzheimer disease.
Prenuvo’s Advanced Brain Health Scan combines structural imaging, NeuroQuant volumetry, and vascular assessment. NeuroQuant’s T1-based volumetric output itself is not an assessment of aneurysms, blood flow, or white matter lesion burden; those conclusions must come from the appropriate acquired sequences and/or separately deployed software modules. Cortechs markets lesion analysis as separate functionality. prenuvo
The following is a proposed workflow based on the technical guidance and validation studies—not a published Prenuvo protocol.
Distinguish:
This matters because diagnostic performance demonstrated in a symptomatic memory-clinic cohort cannot simply be transferred to an asymptomatic screening population. The 2025 study discussed below enrolled patients with cognitive concerns, MCI, or Alzheimer disease—not a general wellness-screening cohort. pubmed.ncbi.nlm.nih
For screening patients, I would use a higher threshold for assigning a disease label than for describing a verified structural finding.
Before letting colored tables anchor your impression, assess:
Atlas methods can fail with markedly distorted anatomy, and the manufacturer specifically identifies severe ventriculomegaly, large pathology, and surgical resection as potential alignment problems. pmc.ncbi.nlm.nih
Check:
Current manufacturer guidance specifies a sagittal 3D T1 sequence and defined acquisition parameters. It also highlights motion and incorrect landmarking as causes of failure; this is particularly relevant when brain imaging follows other body regions in a combined examination. cortechs
Do not build a local protocol from older internet PDFs alone. Published vendor instructions have changed—for example, older and newer materials give different landmarking tolerances and alignment thresholds. Obtain the current instructions for your installed release and approved scanner protocol. cortechs
This is the non-negotiable step. Both manufacturer guidance and independent studies emphasize visual verification of the segmented images. Successful processing is not proof of correct segmentation. pmc.ncbi.nlm.nih
For your early cases, I would inspect:
The precise structures included in a segmentation depend on the algorithm’s anatomical definitions; automated and manual hippocampal methods can differ simply because they include different extents of the hippocampal tail. pmc.ncbi.nlm.nih
My practical rule: if a measurement will influence the impression, its segmentation should be specifically checked.
Consider the combined relationship among:
A low hippocampal volume accompanied by verified temporal horn enlargement and a low occupancy score is more internally coherent with mesial temporal volume loss than an isolated low hippocampal percentile. This is the rationale behind the occupancy metric, although its diagnostic performance remains imperfect. pubmed.ncbi.nlm.nih
A useful reporting sequence is:
This makes it clear whether you are describing an observation, a supported atrophy pattern, or a diagnostic hypothesis.
Hippocampal volume at or below the 5th percentile is a commonly used low-volume threshold in published NeuroQuant studies. It is a reference-distribution threshold, not a disease-specific diagnostic cutoff. pubmed.ncbi.nlm.nih
For a single examination:
Even in a memory clinic, hippocampal volumes and occupancy scores had only modest relationships with objectively measured memory performance. pubmed.ncbi.nlm.nih
These measurements provide context for the adjacent mesial temporal structures. The vendor uses inferior lateral ventricular expansion as part of its estimate of mesial temporal atrophy. cortechs
However, do not automatically interpret large temporal horns as ex-vacuo enlargement. Evaluate the overall ventricular configuration and potential anatomical distortion before accepting that explanation or the associated segmentation. Severe ventriculomegaly can itself interfere with processing. cortechs
The vendor describes:
HOC = V(hippocampus) / [V(hippocampus) + V(inferior lateral ventricle)]
The report distinguishes the numerical score from its age-/sex-referenced normative percentile. Check your particular report’s calculation and bilateral aggregation rather than assuming every report format is identical. cortechs
Interpretation:
Consequently, low hippocampal volume, high ventricular volume, and low HOC are a coherent cluster—not three independent positive diagnostic tests.
Prenuvo explicitly highlights both the hippocampus and entorhinal cortex in its brain-health assessment. prenuvo
I would be cautious about allowing an isolated entorhinal percentile to drive the impression:
That reporting approach follows the general requirement to verify automated segmentation and the limited specificity of volumetric findings; I did not identify an independently validated, Prenuvo-specific entorhinal cutoff for predicting dementia in asymptomatic patients. pmc.ncbi.nlm.nih
Asymmetry can be useful, particularly in seizure evaluation, but verify both sides rather than assuming the smaller side is pathological. NeuroQuant offers a dedicated hippocampal asymmetry report for temporal lobe epilepsy and unilateral degenerative conditions. cortechs
An important caution: in the Mayo study, hippocampal volume reproducibility was excellent, but NeuroQuant asymmetry-index reproducibility was only fair. The study used version 2.0.1, so this should not be represented as the performance of every current release. pmc.ncbi.nlm.nih
For a screening examination, isolated quantitative asymmetry is not sufficient to diagnose mesial temporal sclerosis.
| Pitfall | Why it matters | Practical response |
|---|---|---|
| Accepting a completed report without inspecting labels | Clinically significant errors can survive processing | Review overlays, especially all impression-driving regions. pmc.ncbi.nlm.nih |
| Treating a low percentile as acquired tissue loss | A cross-sectional reference comparison does not directly measure prior loss | Distinguish low volume from supported atrophy. cortechs |
| Calling Alzheimer disease from hippocampal/HOC values | These measures have imperfect diagnostic performance | Describe the structural pattern and correlate clinically. pubmed.ncbi.nlm.nih |
| Treating every flagged region as meaningful | The conventional threshold identifies distributional outliers, not necessarily disease | Prioritize severity, anatomical coherence, QC, and clinical relevance. pmc.ncbi.nlm.nih |
| Motion or an unsupported protocol | Acquisition quality affects segmentation | Request technical review or reacquisition when appropriate. cortechs |
| Distorted anatomy | Atlas registration may fail or mislabel structures | Withhold affected measurements when invalid. pmc.ncbi.nlm.nih |
| Wrong demographics | Normative comparisons use age and sex | Verify metadata before interpreting percentiles. cortechs |
| Comparing different software generations | Algorithms and reference outputs can change | Reprocess comparable source studies in the same supported version when possible. frontiersin |
| Comparing NeuroQuant with another volumetry platform | Absolute volumes and normative percentiles are not interchangeable | Use method-specific norms and avoid direct numerical substitution. pmc.ncbi.nlm.nih |
| Interpreting small serial differences as progression | Repeat measurements have nonzero variation | Require technically comparable studies and change exceeding expected measurement variability. pmc.ncbi.nlm.nih |
A 5th-percentile cutoff necessarily labels some members of the reference population as low for a given structure. When numerous structures are examined, isolated outlying values become less persuasive unless supported by a coherent pattern.
Do not assign an exact false-positive rate to the entire NeuroQuant report by treating every region as independent: regional volumes are correlated, and HOC is calculated from other measurements. The useful clinical implication is to avoid turning every highlighted cell into a separate diagnosis. cortechs
Normal hippocampal volumes do not exclude cognitive impairment or Alzheimer disease. Conversely, an extreme low volume is not specific for either. The independent memory-clinic study supports using these measurements as supporting—not exclusionary or definitive—diagnostic tools. pubmed.ncbi.nlm.nih
Schaffert and colleagues studied 181 patients:
Patients with amnestic MCI, Alzheimer disease, and objective memory impairment had lower hippocampal volumes and HOC scores. However, sensitivity for objective memory impairment ranged from 0.31–0.77 and specificity from 0.68–0.91 across evaluated measures/operating points. Correlations with verbal memory performance were modest, r = 0.20–0.44. These figures concern objective memory impairment—not a single validated test for diagnosing Alzheimer disease. pubmed.ncbi.nlm.nih
For Prenuvo, the key limitation is population applicability: this is not evidence that a low volume in an asymptomatic screening patient predicts future dementia.
The study evaluated 49 patients selected for hippocampal asymmetry, predominantly in an epilepsy context, using NeuroQuant 2.0.1. It found:
That 18% is not a current NeuroQuant error rate for healthy Prenuvo patients. It is evidence that a clinically deployed automated tool can produce consequential errors, making reader QC necessary.
Cortechs materials use the 5th–95th percentile range to highlight potentially important measurements and include examples that attribute a medial temporal pattern to early Alzheimer-related dementia. Those examples are educational vendor cases—not validated rules for asymptomatic screening. cortechs
I would retain the anatomical pattern recognition but use more conservative diagnostic language in your screening practice.
Serial measurements can be valuable, but this is also a major opportunity for overcalling.
Before interpreting progression, verify:
A percentile change is not a percentage volume change. Percentiles reflect a reference distribution, whereas tissue-volume change must be calculated from comparable measured volumes. cortechs
For descriptive calculation:
% ΔV = 100 × [V(follow-up) − V(baseline)] / V(baseline)
But that calculation alone does not establish pathological progression.
In the small repeat-imaging subgroup of the Mayo study, mean normalized within-patient variation was approximately 3.10% for the left hippocampus and 2.22% for the right. These are not universal minimum-detectable-change thresholds, and the subgroup included scans on different scanners over variable intervals. They illustrate why small changes require caution. pmc.ncbi.nlm.nih
I would not adopt a universal “greater than X% per year is abnormal” rule without release-specific and acquisition-specific validation.
These are proposed templates for your use—not official Prenuvo or Cortechs wording. They deliberately distinguish the measured result from its clinical interpretation.
Automated volumetric analysis was performed, and the segmentation was reviewed. Hippocampal volumes and hippocampal occupancy are within the expected reference range for age. No disproportionate medial temporal volume loss is identified.
Avoid adding “no evidence of Alzheimer disease”; the measurements cannot exclude it. pubmed.ncbi.nlm.nih
Total hippocampal volume measures at the __ percentile relative to the age- and sex-adjusted reference population. Segmentation is satisfactory. No convincing associated temporal horn enlargement or disproportionate medial temporal atrophy is identified. This isolated low-volume measurement is nonspecific and does not establish a neurodegenerative disorder.
Bilateral hippocampal volumes are reduced relative to the reference population, with associated inferior lateral ventricular enlargement and reduced hippocampal occupancy. These findings correspond to the medial temporal volume loss visible on the source images. The pattern is nonspecific; correlation with cognitive symptoms and clinical assessment is recommended.
In a patient with documented cognitive impairment, you can add that the pattern may support a neurodegenerative process in the appropriate clinical context. Do not make that leap solely from screening percentiles. pubmed.ncbi.nlm.nih
Automated volumetric analysis is limited by inaccurate segmentation of __. The corresponding regional volumes and derived measurements are not considered reliable and are not used for diagnostic interpretation.
If the hippocampal or inferior lateral ventricular segmentation is invalid, the associated HOC should also be withheld. pmc.ncbi.nlm.nih
Direct quantitative comparison with the prior examination is limited by differences in acquisition and/or analysis software. Apparent numerical differences cannot be confidently attributed to interval tissue-volume change.
The software compares the size of selected brain regions with a reference group of people of similar age and sex. A measurement outside that range does not, by itself, mean there is a memory disorder or predict future dementia. We interpret these measurements together with the MRI images, symptoms, and any prior studies.
That wording is consistent with the tool’s measurement framework and independent diagnostic limitations. pubmed.ncbi.nlm.nih
These are operational requests I would make to establish a safe, consistent workflow:
| Item to request | Why you need it |
|---|---|
| Exact NeuroQuant release/build and report packages | Interpretation and comparability depend on the deployed product. |
| A complete de-identified example case | Confirm which values, plots, and overlays you actually receive. |
| Current scanner-specific approved acquisition protocol | Avoid relying on outdated public parameter lists. |
| Full segmentation DICOM access in PACS | QC cannot be done adequately from the PDF table alone. |
| Clinical history available to readers | Distinguish screening from symptomatic evaluation. |
| Local handling of technical failures | Clarify repeat acquisition, reprocessing, and invalid-result reporting. |
| Policy for low percentiles and referral wording | Avoid inconsistent disease labeling across readers. |
| Longitudinal processing policy | Clarify software upgrades, scanner changes, and reanalysis of prior studies. |
| Patient-facing report and counseling language | Ensure a nonspecific percentile does not become a dementia diagnosis downstream. |
The need for these controls follows directly from the acquisition requirements, segmentation-error evidence, and software comparability limitations. pmc.ncbi.nlm.nih
For your initial calibration, I would specifically ask for examples of normal studies, isolated low percentiles, convincing medial temporal atrophy, asymmetry, motion, segmentation failure, ventriculomegaly, and serial studies affected by software or acquisition changes. This would make the onboarding much more useful than simply learning where the percentile values appear.
A de-identified NeuroQuant report, its segmentation images, and the installed software version are needed to map this framework to the local reading workflow.